Supplies:
- Crayola Model Magic - Assorted Colours
- Crayola Construction Paper - 22.9 cm x 30.5 cm (9" x 12")
- Crayola Glitter Glue
- Crayola Scissors
- Crayola Washable No-Run School Glue
- Rulers
- Rolling Pins or Dowels
- Small Cookie Cutters
Steps:
1
- Make 3 batches of shapes.
- Make each batch a different colour.
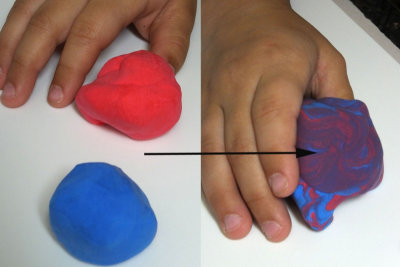
- Make at least one batch a mixed colour.
- To make a mixed colour choose 2 primary colours and blend them together.
2
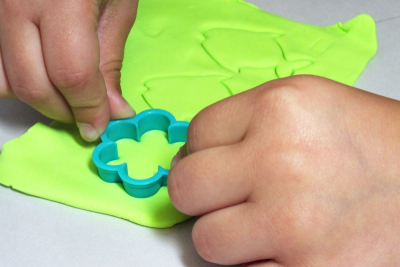
- Choose one batch of Model Magic and roll it out until it is about .5 cm (1/4”) thick.
- Use a variety of cookie cutters to make some shapes.
- Repeat with the other 2 batches to make a total of about 15 shapes.
3
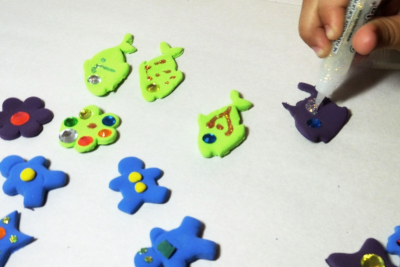
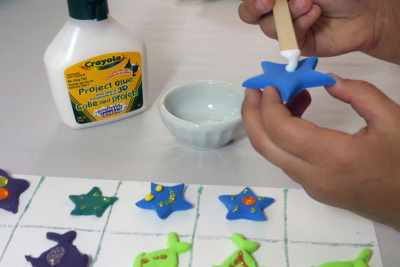
- Use small pieces of Model Magic, glitter glue or beads to add details to each shape.
- Set the shapes aside to dry overnight.
4
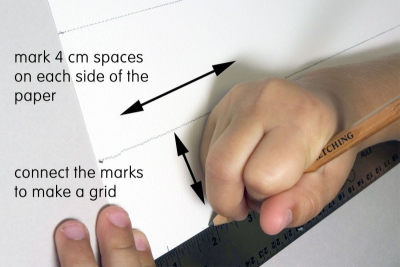
- Mark 4 cm spaces on each side of the paper.
- Join the dots on opposite sides of the paper to create a grid.
5
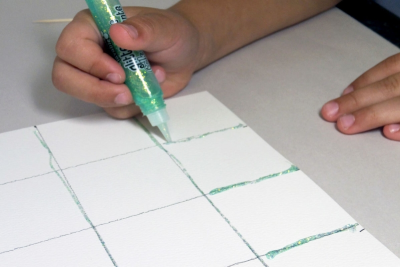
- Use glitter glue to trace over all the lines on the graph.
- Glue from the top of the line to the bottom so your hand does not get in the way.
- Put the paper aside to dry.
6
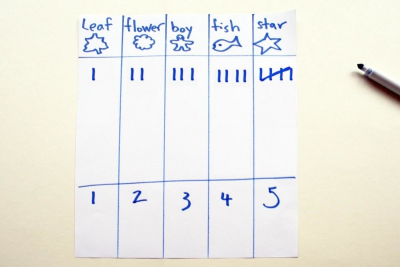
- Sort similar shapes into groups.
- Use a tally sheet to count the number of shapes you have in each group.
- Each time you count a shape, make a mark in the column for that shape.
- Add up the total for each shape and write it on the bottom of your tally sheet.
7
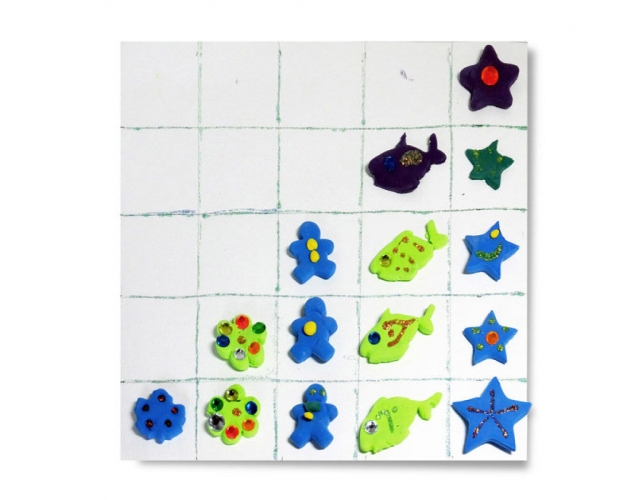
- Use Crayola Washable Glue to attach your shapes to the grid.
- Make sure you place similar shapes in the same column to make your picture graph.
8
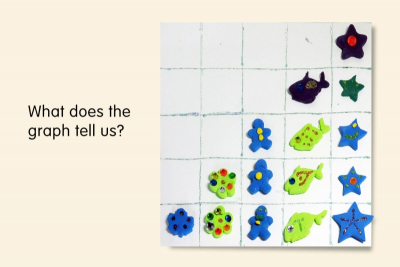
- View your picture graph with fresh eyes.
- What does it tell us?
Subjects:
Grades:
Grade 1,
Grade 2